Let's be honest - that moment when you first see your solar panels glinting in the sunlight, you're imagining dollar signs. Lower bills, energy independence, maybe even feeding power back to the grid. Then comes that first electric bill after installation, and the excitement fades just a bit. "Wait, why aren't I getting what the brochure promised?"
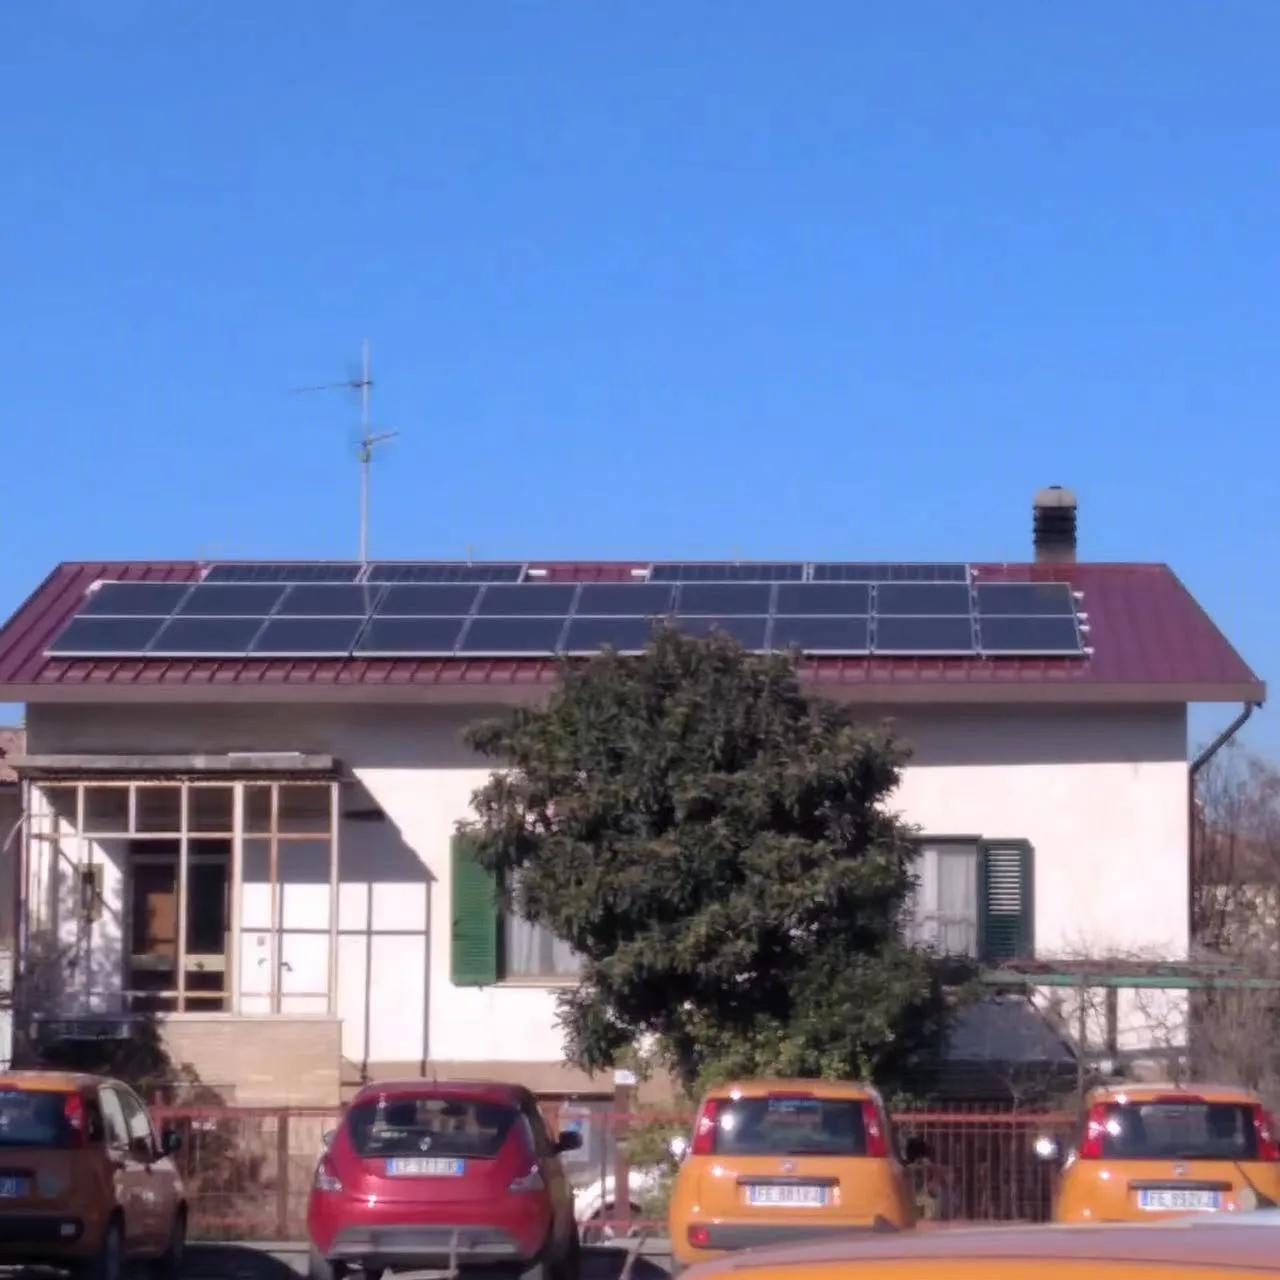
Take Sarah in Arizona. Her installer guaranteed 95% of the 6kW system's promised output. But during summer's peak, her panels underperformed by 22%. The culprit? Her black tile roof baked at 160°F, making her panels sweat and slump like overcooked noodles.
This gap between promise and reality isn't deception - it's physics. Solar panels get rated under perfect laboratory conditions called STC (Standard Testing Conditions). But unless you're running solar panels on Mars with space-grade cooling systems, your backyard will never match these ideal parameters.
STC serves as the solar industry's universal benchmark. Think of it like nutrition labels on food packaging - it allows fair comparison between products. Here's what makes STC so... well, standard:
These conditions let manufacturers say: "Our premium panel delivers 400 watts!" But put that panel on a dark roof in Houston where the air feels like warm soup, and that number drops fast. It's not that the rating was wrong - it's just measuring something that never exists in the real world.
STC is solar's SAT score - useful for comparison but tells you nothing about real-world performance. A panel that scores well in the lab might choke in Phoenix heat, while another might outperform when the going gets tough.
| Ideal Lab World (STC) | Real World Challenges | Performance Impact |
|---|---|---|
| Perfect 25°C (77°F) | Roof temperatures hitting 70°C (160°F) | Efficiency drops 0.3-0.5% per °C above 25°C |
| 1000W/m² light intensity | Haze, pollution, seasonal angles that reduce intensity to 800-900W/m² | Production declines linearly with reduced sunlight |
| Clean glass surface | Dust, pollen, bird droppings accumulating | Up to 25% monthly loss without cleaning |
| Perfect angle to sun | Fixed roof angles getting imperfect sun exposure | Annual losses of 5-15% with non-optimal tilt |
But here's where it gets trickier - these factors don't just add up, they multiply. A dusty panel on a hot day with hazy skies? That's when the performance cliff really hits. It's why engineers have nightmares about Arizona summers and Siberian winters.
Don't lose hope! While we can't change physics, smart approaches can claw back much of that "lost" power:
But let's be candid - the biggest gains come during design. Using NOCT (Nominal Operating Cell Temperature) ratings instead of STC gives you real-world estimates. Better yet, use sophisticated simulation tools that incorporate YOUR specific location data.
Consider this installation in Riyadh: Using STC would have predicted 32MWh annual output. But by simulating actual weather patterns, installation angle, and local dust accumulation, the designers correctly projected 24MWh - and installed extra panels upfront to meet the customer's actual needs.
The solar industry knows STC is increasingly outdated. New standards like PVUSA and DIN SPEC 4862 are emerging that better simulate reality, though adoption remains slow. Meanwhile, advanced monitoring lets homeowners track what's actually happening on their roofs.
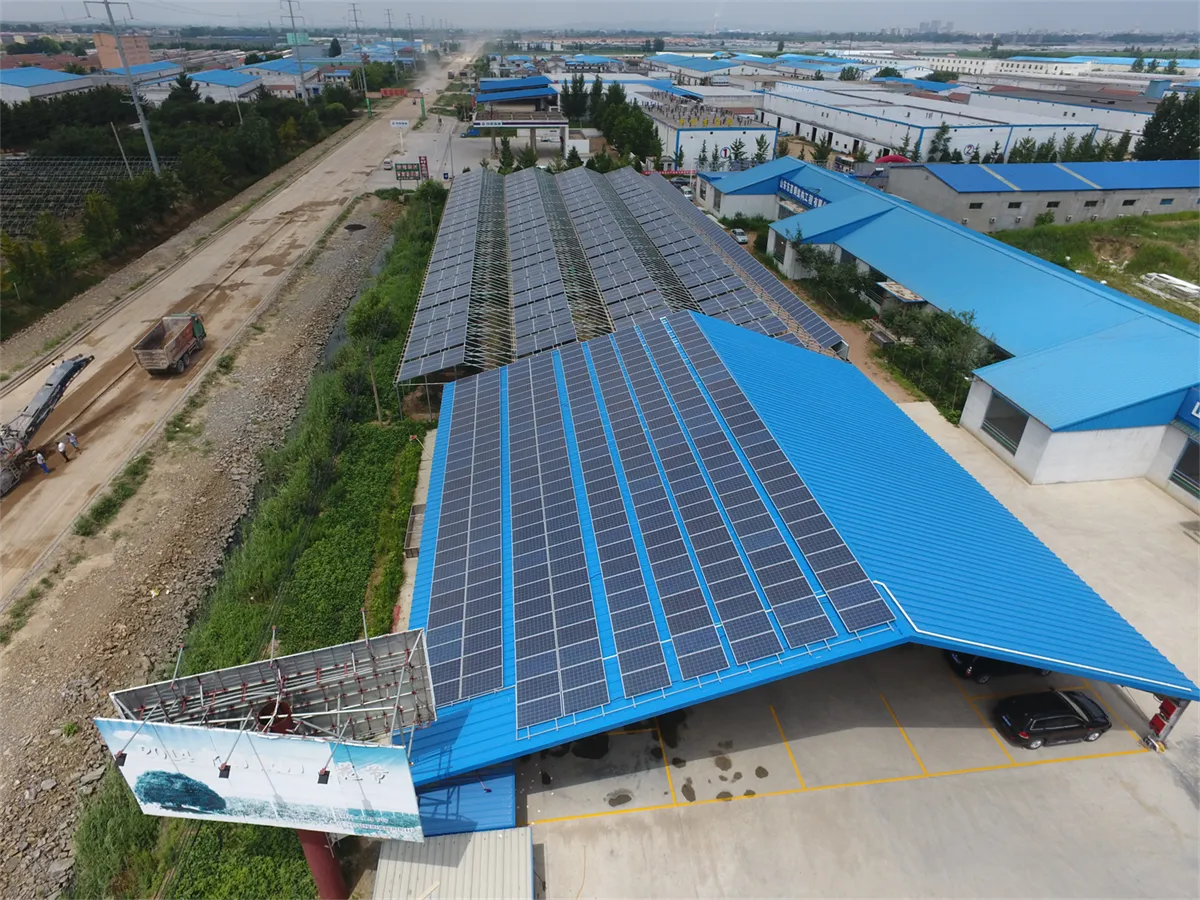
Ultimately, panels are just one piece of the solar puzzle. The true magic happens in designing commercial and industrial solar energy solutions tailored to local realities - not just laboratory ideals. That's where the genuine breakthroughs are happening.
STC gives us a starting point, but energy production comes from understanding and adapting to nature's variables. The panels that test perfectly in the lab? They're not necessarily the ones that will shine brightest on your particular rooftop. The best systems listen to what the sun and seasons actually do, not what they're supposed to do.
Recommend Products