

So you've taken the leap and installed solar panels on your home – fantastic! But like any major home upgrade, the real work begins after the installers pack up their tools. Think of this phase as your solar system's "shake-down cruise" where we ensure everything performs exactly as promised. You wouldn't drive a new car without checking the gauges, right? The same goes for your solar investment.
Over the next few minutes, I'll walk you through what I call the " Solar TLC Protocol " – a practical, step-by-step approach to verifying your system's health. We'll cover everything from visual inspections you can do this weekend to performance metrics you should monitor long-term. Along the way, we'll incorporate crucial testing methods that even some professionals overlook.
The 72-Hour Post-Installation Checklist
Physical & Visual Inspection
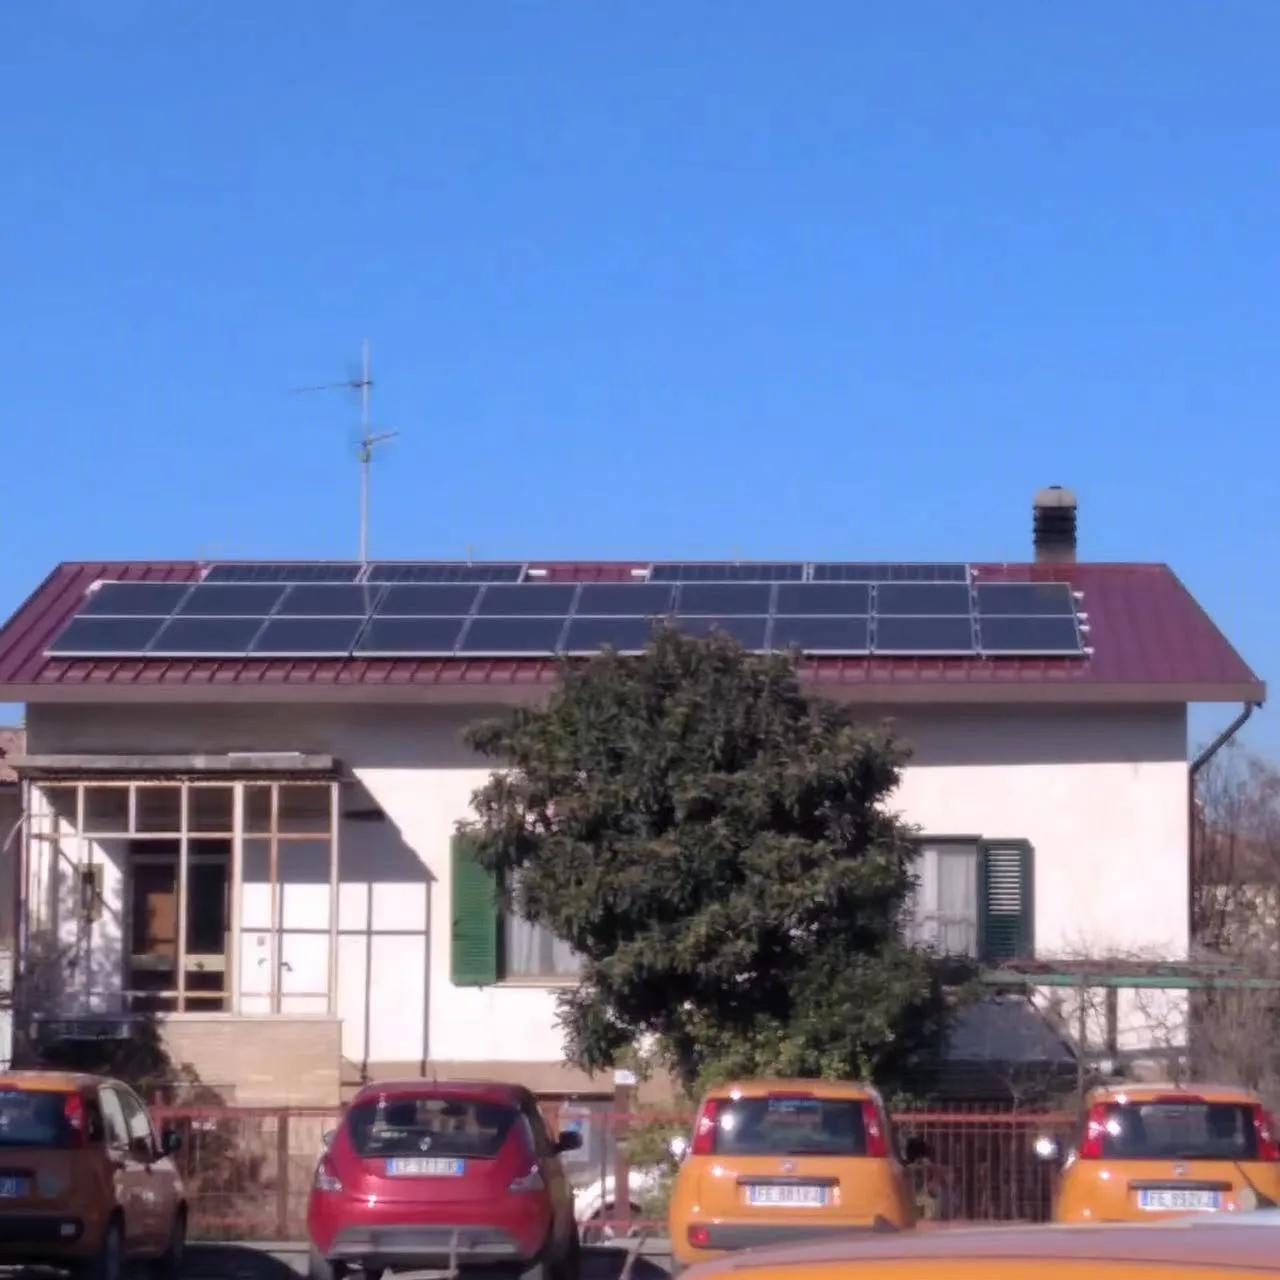
Start with what your eyes can see. Check panel alignment – no wonky angles or visible gaps. Examine mounting hardware for any signs of stress. Look for micro-cracks on panels (use your phone's flashlight at dawn/dusk when shadows highlight imperfections). Verify conduit runs are secured every 18 inches per electrical code. I once found a squirrel-chewed wire just 48 hours post-install!
Inverter Boot-Up Sequence
Your inverter is the system's brain. When first powered, it should cycle through a clear startup sequence without error lights. Modern inverters display status codes – snap a photo of the screen and compare it to your manual's "normal operation" indicators. Listen for unusual humming or clicking that could signal transformer issues.
Monitoring App Activation
Don't wait for billing cycles! Connect to your monitoring app immediately. Verify real-time data flow and test alert settings. Pro tip: Cover one panel with cardboard briefly to trigger a "low production" alert – this confirms your monitoring sensitivity. Check if the app displays correct panel-level data if you have optimizers.
Roof Integrity Validation
This one's critical. Inspect your attic for daylight peeking through penetration points or water stains. Do the " rain dance test " – run a hose over mounted areas while someone checks indoors for leaks. Verify flashing integration with your roofing materials – a key compatibility consideration that impacts long-term performance.
Performance Testing: Beyond the Basics
The Dawn-to-Dusk Calibration
Day 1-7Track energy production from first morning light until evening shutdown. Ideal curve? Gradual ramp-up, plateau at midday, smooth decline. Jagged dips suggest shading issues – trace the cause (new tree growth? neighbor's satellite dish?). Compare actual output versus installer projections. A >10% variance warrants investigation.
Cloud Stress Test
Variable WeatherDon't just test on sunny days! Monitor performance during partly cloudy conditions. Well-functioning systems rebound quickly when clouds pass – watch your monitoring app for sudden production spikes. Persistent "cliff" drops indicate possible voltage mismatches or optimizer failure. Modern systems should never flatline during light cloud cover.
Inverter Efficiency Spot Check
MonthlyCompare panel output (DC) to what your inverter sends to the grid (AC). The conversion ratio should match your inverter's spec sheet (typically 97-99% efficient). Calculate: (AC output ÷ DC input) x 100. Consistent readings below 95% signal inverter problems or excessive wiring losses.
Troubleshooting: Real-World Case Studies
The Phantom Power Drain
Symptoms: System produced 22% less than projected despite perfect equipment readings.
Discovery: Homeowner's energy monitoring revealed midnight power spikes.
Solution: A malfunctioning pool timer was drawing excess power at night. Resetting load management settings restored projected output.
The Invisible Shading Culprit
Symptoms: 15-minute afternoon production dips despite no visible obstructions.
Discovery: Time-lapse photography showed a distant cell tower's shadow crossing panels.
Solution: Repositioned two panels and added bypass diodes – eliminated ~90% of losses.
The 90-Day System Health Report
Performance Degradation Tracking
CriticalCompare monthly production against installer guarantees. Normal degradation: 0.5-0.8%/year. Use formula: (Current Output ÷ Initial Output) ÷ Months Operational. Calculate degradation rate across different seasons to account for weather variations.
Weather-Normalized Benchmarks
RecommendedTools like PVWatts Calculator help eliminate weather variables. Input your location and system specs to get "expected" monthly values. Your actual should fall within 10% of this figure consistently.
Season-Specific Watch Points
- Spring: Pollen accumulation – reduce output by up to 5%. Check after rain events.
- Summer: Heat-related efficiency drop – panels lose ~0.5%/°C above 25°C (77°F).
- Fall: Leaf debris and angle changes – adjust cleaning frequency.
- Winter: Snow shedding patterns – note areas needing manual clearing.
Your Solar System's Lifelong Health Plan
Think of your post-installation verification as establishing a health baseline – the foundation for decades of optimal performance. That initial 72-hour checklist? Do it quarterly. The performance benchmarks? Set calendar reminders every six months. And when anomalies appear, remember that most issues reveal themselves through patterns, not single data points.
Solar technology has evolved remarkably, becoming smarter and more resilient. Modern commercial and industrial solar energy solutions now offer unprecedented efficiency and longevity, giving homeowners powerful tools to maximize their investments. By following this protocol, you're not just protecting equipment – you're ensuring every sunrise reliably transforms into tangible savings and sustainability.
Pro Tip: Maintain a "solar journal" – note cleaning dates, output spikes, and maintenance. In 20 years when you're still getting 90%+ production, you'll appreciate documenting the journey!