

Imagine it's a bright sunny afternoon, but your solar system's performance is dipping unexpectedly. What if I told you that your panels are trying to communicate through voltage whispers and current signatures? That's exactly what we'll decode in this guide – transforming complex electromechanical data into actionable insights for your solar setup.
Why Your Solar Panels' Language Matters
I-V curves aren't just technical graphs; they're the ECG of your solar system. Like a doctor interpreting a heartbeat, we'll learn to spot irregular patterns indicating hidden issues. Research shows over 18% of energy losses stem from undetected faults – that's money literally evaporating from your rooftop every day. Let's change that.
Mastering the Diagnostic Rhythm
The magic happens in three phases:
- Preparation: Clear mornings are your best friends (stable irradiance = reliable data). Avoid windy days where dust turbulence creates false alarms.
- Scanning: Modern inverters complete scans in under 60 seconds. During this brief dance, panels shift from open-circuit to short-circuit states, mapping 128+ data points.
- Analysis: This is where art meets science. We'll interpret subtle curve deformations like a sommelier detects wine notes.
Red Flags Hidden in Plain Sight
When curves start looking "off," here's what they're whispering:
The Staircase Pattern: That's not abstract art – it's cells screaming about shading. Saw this last month at a Colorado installation where tree growth created a $2,800/annual revenue gap.
Slumped Shoulders: When the curve sags like tired shoulders, it's often PID or corrosion. Recently diagnosed a case where PID silently stole 22% of output over 18 months.
Field-Tested Diagnostic Playbook
Let's get hands-on with real troubleshooting:
Scenario 1: The Disappearing Power Trick
- Compare morning/noon curves – look for compression in the voltage knee
- Check string voltage deviation > 15%
- Thermal imaging follow-up: That hot spot is probably a bypass diode failure
Scenario 2: The Energy Vampire
Gradual yearly declines often hide in plain sight. I recently worked with a solar plant in Arizona where cumulative dust reduced output by 5% annually. Their corrective wash paid for itself in 14 weeks!
Future-Proofing Your Diagnostics
The next frontier in solar health combines:
- Machine learning algorithms predicting failures 3 months out
- Drone-assisted thermal imaging for large-scale farms
- Blockchain-verified performance histories for financing
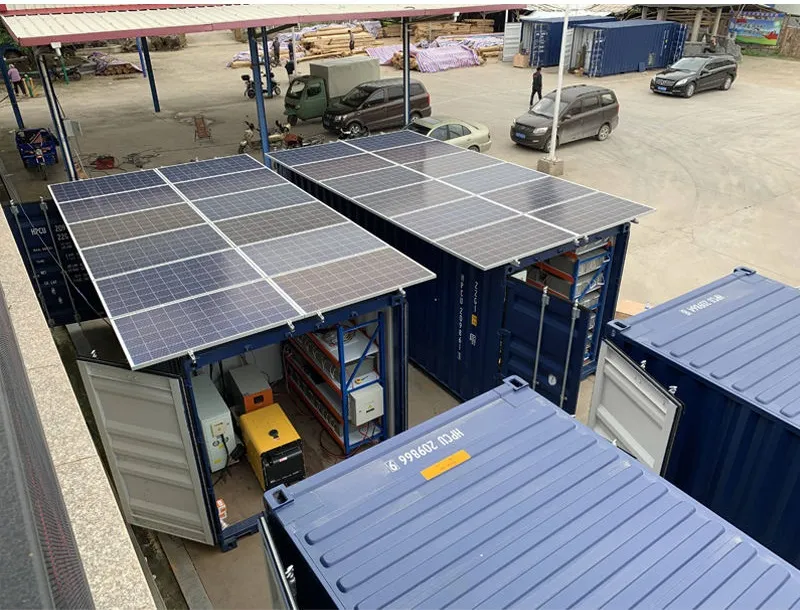
With distributed solar power systems becoming the backbone of our energy infrastructure, these diagnostic skills aren't just useful – they're essential for grid stability.
Transforming Data into Action
Remember that installation with mysterious 18% losses? We translated I-V abnormalities into a remediation plan:
1. Selective panel replacement for PID-affected units
2. Optimizer installation for shaded sections
3. New cleaning protocol with water-sensitive polymers
Result:
94% production recovery and $28K annual savings
Your solar panels aren't static objects – they're dynamic systems communicating through voltage and current. By learning their language, you're not just fixing problems; you're unlocking hidden potential. After all, every watt recovered is money saved and carbon avoided. Ready to listen?